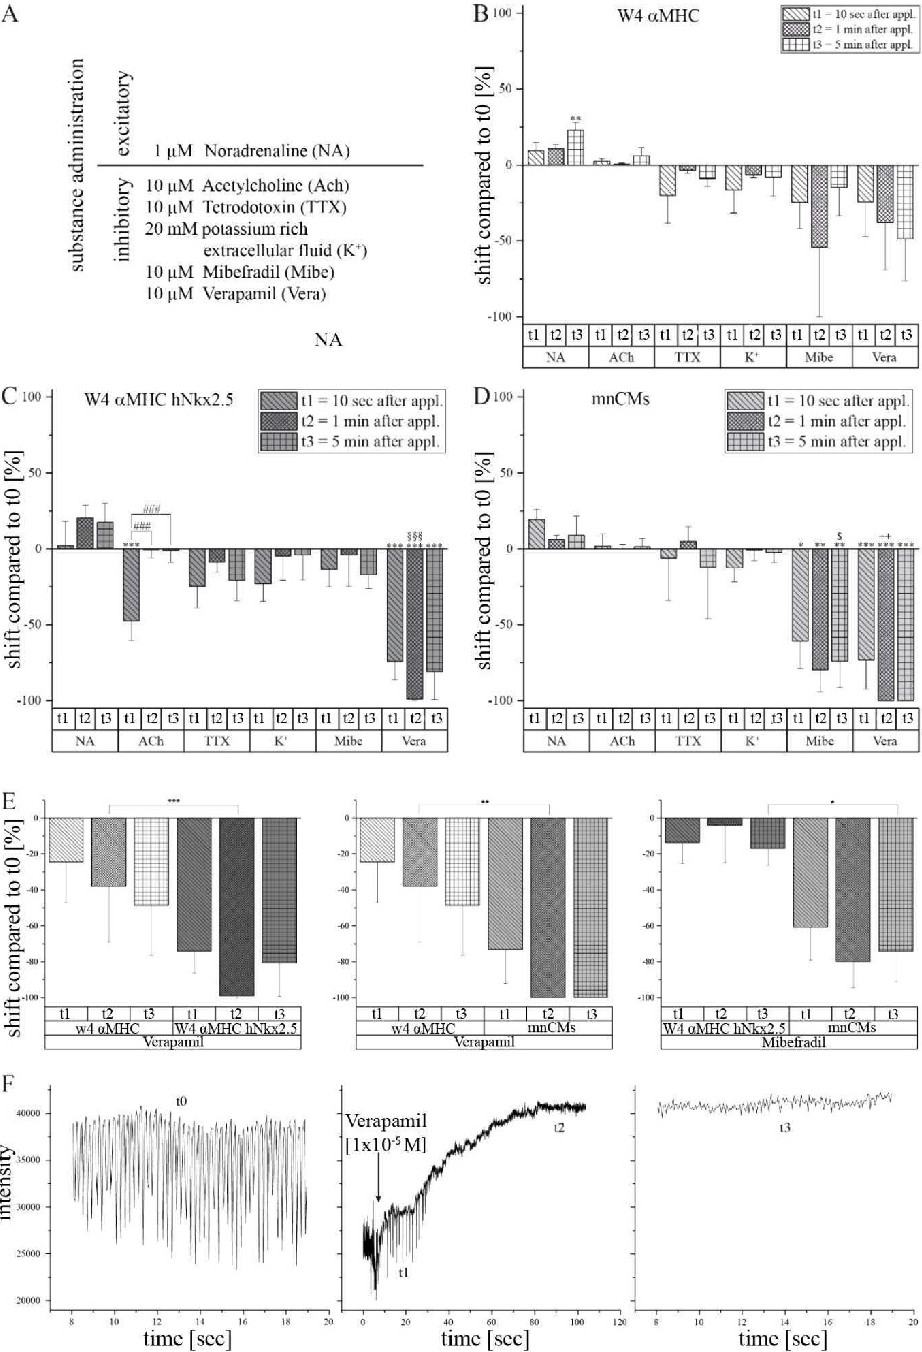
Fig. 6. Response of beating frequencies to pharmacological substance administration: Analysis of beating frequencies after administration of (A) indicated amounts of inhibitory and excitatory pharmacological substances on obtained CM-like single cells of (B) W4 αMHC, (C) W4 αMHC hNkx2.5 and (D) monolayer murine neonatal cardiomyocytes in relation to baseline frequencies recorded for every individual cell (t0). (E) separate statistical overview of Verapamil and Mibefradil to illustrate significant differences. (F) Representative examples for beating frequencies of a W4 αMHC hNkx2.5 programmed single cell before (t0) and after (t1, t2, t3) Verapamil application using ELYRA PS.1 LSM 780 confocal microscope and ZEN2011 software. Values are presented as mean ± SEM; n=3-17; statistics were performed as multiple comparison of mean, */#/$ p ≤ 0.05, **/##/++ p ≤ 0.01, ***/###/§§§ p ≤ 0.001. (*: comparison to t0, #: comparison within all time points (t1, t2, t3), $: comparison W4 αMHC hNkx2.5 and mnCMs, ++: comparison W4 αMHC and mnCMs, §§§: comparison W4 αMHC and W4 αMHC hNkx2.5).